Market Analysis · April 2026
Prepared exclusively for
Roberto & Marcella Reyes
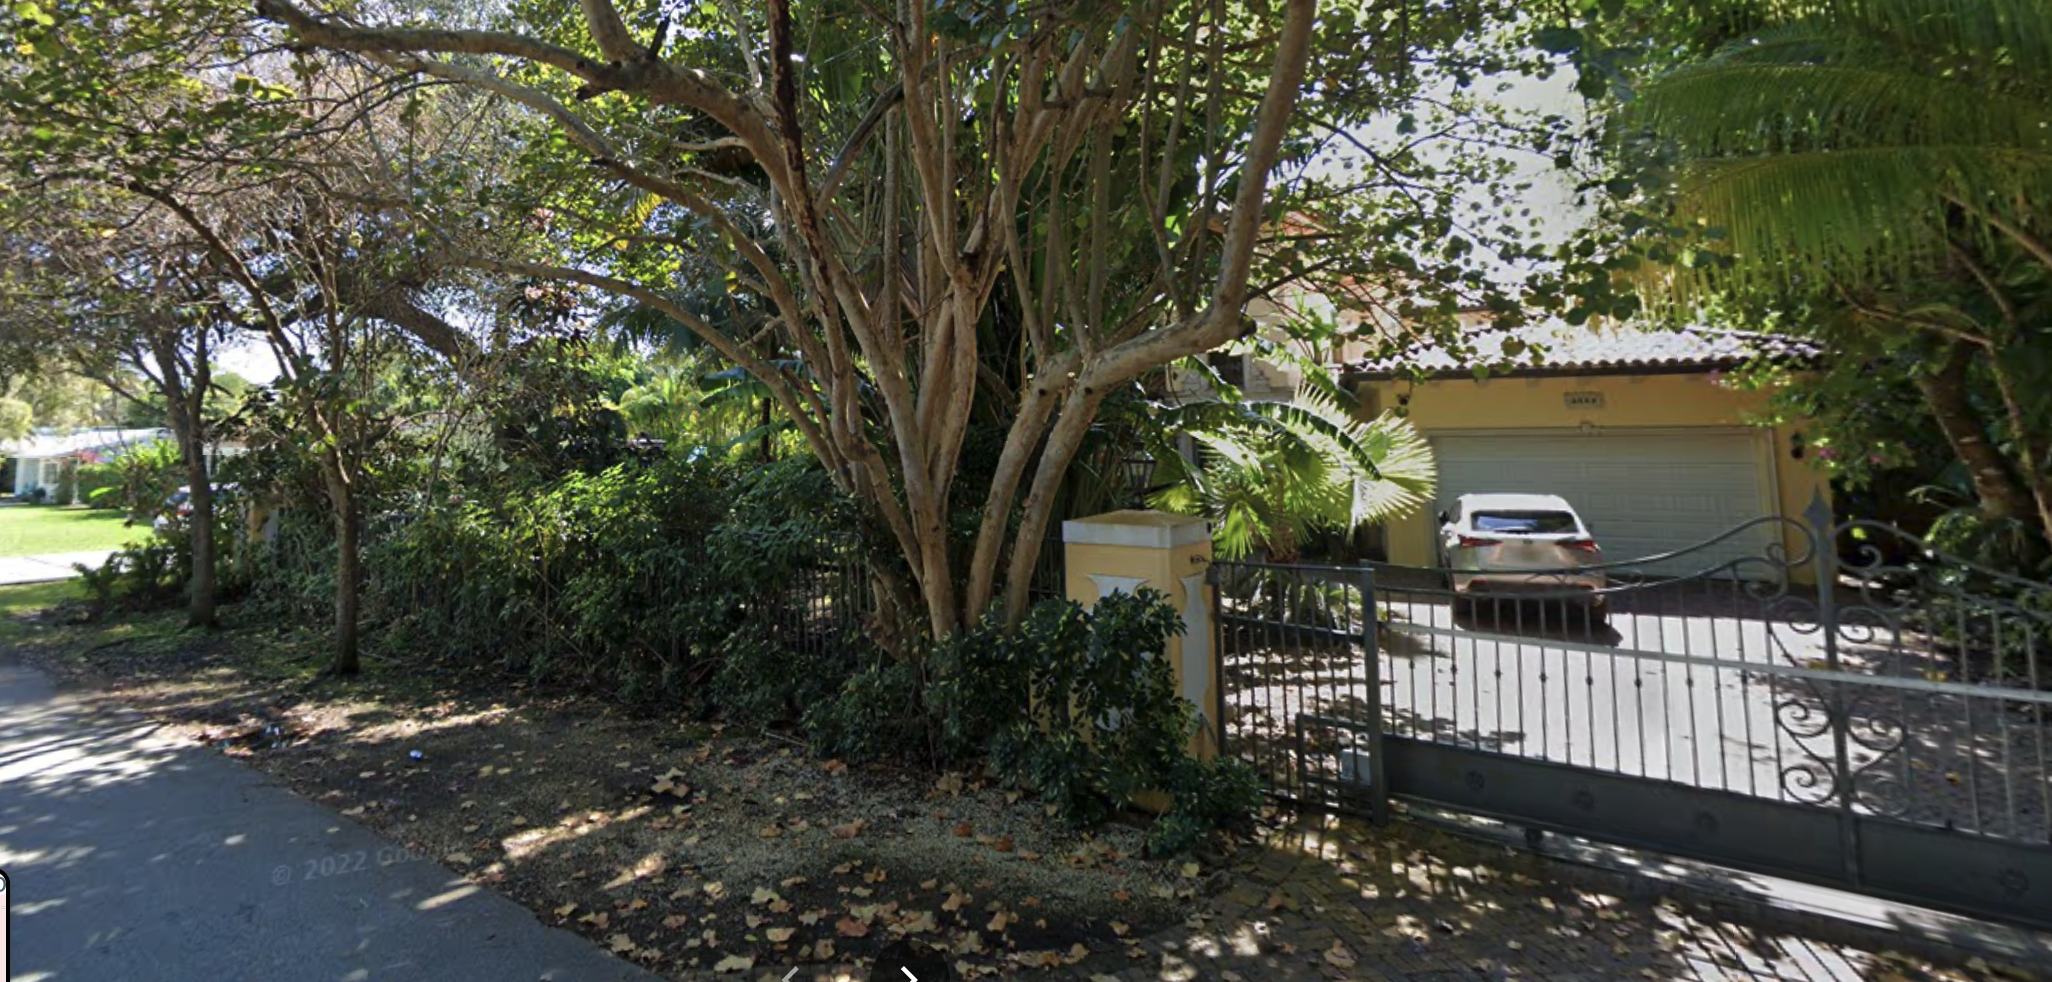
6550 SW 75th Terrace
South Miami, Florida 33143
South Miami · Private Residence
Scroll to explore

I'm a full-time real estate professional based in Coral Gables, proudly serving the greater Miami area for over 8 years. I specialize in luxury homes, large-lot properties, new construction, and income-producing investment opportunities — with deep expertise in South Miami, Coral Gables, Coconut Grove, and the surrounding neighborhoods. I combine market knowledge with a modern, data-driven approach and a marketing engine built to put your home in front of the right buyers. My goal is always the same: your best possible outcome.
Prepared for Roberto & Marcella Reyes
This property is difficult to comp — it is one of the largest non-new-construction homes in the immediate South Miami market. The comparable properties below include both currently active listings and recently closed sales in the same South Miami and Glenvar Heights corridor. Active comps set the ceiling for what buyers are willing to entertain today; closed comps show where motivated buyers and sellers actually found agreement. Read both together — the gap between where things are listed and where they close is the market's clearest signal.
| Property | Status | Bed / Bath | Living Area | Yr Built | Days on Mkt | List Price | Sold Price | $ / sq ft |
|---|---|---|---|---|---|---|---|---|
| Subject 6550 SW 75th Ter, South Miami 33143 | — | 5 / 5 | 5,187 sq ft | 2007 | — | — | — | — |
| 7625 SW 75th Ave, Miami 33143 MLS# A11327994 | Active | 6 / 4 | 3,770 sq ft | 1995 | 1,029 | $3,399,000 | — | $901 / sq ft |
| 7140 SW 70th Ave, Miami 33143 MLS# A11981807 | Active | 4 / 4 | 3,525 sq ft | 2007 | 71 | $3,249,000 | — | $922 / sq ft |
| 5045 SW 67th Ave, South Miami 33155 MLS# A11848231 | Active | 5 / 5.5 | 5,693 sq ft | 2005 | 170 | $2,950,000 | — | $518 / sq ft |
| 6645 SW 73rd Ct, Miami 33143 MLS# A11894842 | Closed · May 2026 | 4 / 3 | 4,328 sq ft | 1946 | 157 | $3,095,000 | $3,095,000 | $715 / sq ft |
| 6481 SW 73rd St, South Miami 33143 MLS# A11766024 | Closed · Sep 2025 | 3 / 3 | 2,600 sq ft | 1959 | 146 | $2,249,000 | $2,150,000 | $827 / sq ft |
| 6761 SW 71st Ct, Miami 33143 MLS# A11892079 | Closed · Aug 2025 | 3 / 5 | 3,978 sq ft | 2015 | — | — | $3,500,000 | $880 / sq ft |
Same street as subject — over 1,000 days on market and still no deal. New roof (2024) and genuine upgrades, yet buyers won't engage at $901/sqft. The cautionary tale: a solid asset frozen by overpricing. When buyers are budgeting $300K–$500K for renovation, they simply cannot absorb a $900+/sqft entry price.
View Listing →Custom-built 2007 estate on 15,000 sqft lot — same vintage as the subject but 1,650 sqft smaller. At $922/sqft and 71 days in with no deal, it confirms buyers will pursue turnkey product in this corridor, but only up to a point. The turnkey premium is real; the as-is discount is equally real.
View Listing →The most size-comparable active listing (5,693 sqft vs. subject's 5,187 sqft). Originally listed at $3,450,000 — has been reduced three times and is still sitting at $518/sqft after 170+ days. This is the clearest signal for where the market draws the line on large, unrenovated product in this corridor.
View Listing →All-cash close at full asking on a builder's acre (38,768 sqft lot) in Glenvar Heights. Separate pool house, tropical landscaping, EV charger, gated — sold in 157 days at $715/sqft. Strong signal that the right buyer will pay a significant premium for scale and land in this pocket when the product is unique and the price reflects the full picture.
View on MLS →Stunningly remodeled 3BR/3BA on a cul-de-sac lot — primary suite with private study, wood floors, pool with trellis. Sold at $827/sqft after 146 days on market. The renovation premium is real and quantifiable: a fully updated smaller home commands 60%+ more per sqft than unrenovated large-format product.
View on MLS →Highest $/sqft closed comp in the set — and it sold without a pool. Built in 2015 with newer finishes, this 3BR on 20,000 sqft closed at $880/sqft, setting the area ceiling for move-in ready product. Buyers are active and willing to pay top dollar in this corridor — the right product at the right price moves.
View on MLS →The active comp most comparable in size — 5045 SW 67th Ave (5,693 sqft) — has been sitting at $518/sqft for 170+ days after multiple price reductions. Meanwhile, the closed comps tell a different story: smaller, updated homes in the same corridor are closing at $715–$880/sqft. The gap is the renovation premium. At $646/sqft ($3,350,000), this home is priced on the lower end of closed comparable sales — well below the cost of turnkey replacement in South Miami, and supported by closed comps at scale.

Closed $/sqft data for updated smaller homes in the corridor confirms $715–$880/sqft. The most size-comparable active listing (5045 SW 67th Ave, 5,693 sqft) has been reduced three times and sits at $518/sqft after 170+ days — demonstrating that unrenovated large-format product requires precise pricing. At this scale, the buyer who can absorb a full renovation is the target, and that buyer responds to confident, data-supported pricing that reflects renovation reality. This environment supports positioning in the $3,550,000–$3,750,000 range.
Enters at the top of the justified range, targeting the buyer who will pay a premium for this rare combination of 5,187 sqft, 16,500 sqft lot, and 2007 build in South Miami. Creates meaningful negotiating room and signals confidence in the asset's scale and location.
At $684/sqft, this home is priced on the lower end of closed comparable sales ($715–$880/sqft) — correctly reflecting renovation scope while commanding full value for the lot, size, and South Miami location. This price generates active buyer engagement from day one and targets a negotiated close at or above $3,500,000.
The market is signaling we are overpriced relative to competing inventory. Time to reassess.
We are above active buyers' search thresholds. The listing needs a price or marketing adjustment immediately.
Regardless of activity, we conduct a full pricing review at 30 days — reassessing against any new comps, market shifts, and current competition.
At $684/sqft, this home is priced on the lower end of closed comparable sales ($715–$880/sqft) — correctly reflecting the renovation reality while capturing maximum value for the lot, size, and South Miami location. Both strategies target a negotiated close at or above $3,500,000.
Every home is different. Every seller has different priorities. I offer three compensation-based marketing plans so you can choose the level of exposure and service that aligns with your goals — and only pay for what you actually want.
These are actual reels and content produced for real listings — the same quality and strategy applied to your home.
Every home gets professional photography that showcases it at its best — drone, HDR interiors, and 3D walkthrough. Here are examples from recent sales.
Per the August 2024 NAR settlement, sellers are no longer required to offer buyer's agent compensation through the MLS. This gives you full flexibility in how you structure your agreement.
The majority of buyers are represented by their own agent. Offering compensation keeps all buyer pools fully open and removes friction at the offer stage — but the amount, if any, is entirely your decision.
For the purposes of this presentation, we're showing 3% buyer's agent compensation as a working number in the net proceeds calculator. The sale price dropdown lets you model all six scenarios ($3,200,000–$3,700,000). We can revisit and adjust this at the time a specific offer is received.
| Listing Compensation (Momentum) | 3% |
| Buyer's Agent Compensation (working figure) | 3% |
| Total Compensation | 6% |
Buyer's agent compensation is a negotiating point at the time of contract. The 3% shown here is for illustration only — your actual exposure will be calculated against any offer received, giving you a real-time net sheet at every stage.
Use the selectors below to model different sale prices and compensation scenarios. Figures are estimates — your final net sheet with exact mortgage payoff will be prepared at the listing appointment.
| Sale Price | $3,500,000 |
| Less: Listing Agent Compensation — Momentum (3.0%) | –$105,000 |
| Less: Buyer's Agent Compensation (3.0%) | –$105,000 |
| Less: Miami-Dade Doc Stamp Tax (0.6%) | –$21,000 |
| Less: Title / Settlement Fee | –$1,500 |
| Less: Prorated Property Taxes (est.) | –$20,500 |
| Less: Mortgage Payoff | [Confirm with lender] |
| = Estimated Net BEFORE Mortgage | ~$3,247,000 |
Miami-Dade documentary stamp tax: $0.60 per $100 of sale price (0.6%).
Your final net proceeds depend on your remaining mortgage balance. Jose will provide a personalized net sheet at the listing appointment with your exact payoff figure factored in.
Florida has no state income tax. Federal capital gains rules apply — if this is your primary residence (lived in 2 of the last 5 years), you may exclude up to $250,000 ($500,000 married, filing jointly) in capital gains under IRS §121. Consult your CPA.
Per the August 2024 NAR settlement, buyer's agent compensation is no longer required to be offered via MLS. Compensation structure will be discussed at the listing appointment and is fully negotiable. Use the selector above to model different scenarios.
Selling a home of this size and value raises an important question: take your proceeds now, or hold this asset as a long-term rental investment? Below is an honest financial comparison to help Roberto & Marcella think it through. All figures are estimates — consult your CPA and financial advisor before making any decision.
Rental comp range: $10,500–$14,000/month for comparable South Miami homes. At 5,187 sq ft, 5 bedrooms and 5 bathrooms on a 16,500 sq ft lot, a conservative rental estimate of $12,500/month is well-supported by the market, with upside potential if targeted cosmetic updates are made before placing a tenant.
| Estimated Sale Price (negotiated) | $3,500,000 |
| Less: Agent Compensation (6%) | –$210,000 |
| Less: Doc Stamp Tax (0.6%) | –$21,000 |
| Less: Settlement Fee | –$1,500 |
| Less: Prorated Taxes (estimate) | –$20,500 |
| Less: Mortgage Payoff | [Confirm with lender] |
| Estimated Net Before Mortgage | ~$3,247,000 |
If this is your primary residence (lived in 2 of the last 5 years), you may exclude up to $500,000 in capital gains (married, filing jointly) under IRS §121. Selling now captures the maximum exclusion. Florida has no state income tax. Consult your CPA.
| Gross Rent (12 months at $12,500/mo) | $150,000/yr |
| Less: Vacancy (7.5% of gross) | –$11,250/yr |
| Less: Re-rental Fee (1 month) | –$12,500/yr |
| Less: Property Taxes (est., without homestead) | –$40,000/yr |
| Less: Insurance (investment property, est.) | –$16,000/yr |
| Less: Pool + Yard Maintenance | –$4,800/yr |
| Less: General Maintenance (est.) | –$15,000/yr |
| Less: Property Management (8%) | –$12,000/yr |
| Net Annual Cash Flow (pre-debt service) | ~$38,450/yr (~$3,204/mo) |
⚠️ This is BEFORE any mortgage debt service. If a mortgage remains, deduct monthly P&I to get true cash flow. At a $1.5M balance at 4% (~$7,200/mo), the property would generate negative cash flow of approximately –$47,950/year. When homestead exemption is lost, Miami-Dade taxes on a $3M property can reach $55,000–$65,000/year. Investment property insurance typically runs 15–20% higher than homestead rates. Rental income does generate landlord deductions — mortgage interest, depreciation, maintenance — which can meaningfully reduce taxable rental income. Consult your CPA.
Per IRS §121(b)(4), converting your primary residence to a rental does not eliminate the $500,000 exclusion (married, filing jointly), but it reduces it proportionally. Gain allocated to the “nonqualified use” rental years is not eligible for exclusion. Additionally, any depreciation claimed during the rental period is subject to 25% recapture and cannot be excluded under any circumstance. Selling now captures the full exclusion on all qualifying gain. Source: IRS Publication 523.
Miami-Dade’s Save Our Homes cap can significantly shield a long-time owner from rising assessed values. The moment this property converts to a rental, the homestead exemption is lost and the property is reassessed closer to market value. On a $3M home, annual taxes without homestead can reach $55,000–$65,000/year. This is often the largest financial surprise for owners who decide to hold and rent.
At ~$1,767/month in projected pre-debt cash flow — and potentially negative after any mortgage — the effective return on $2.7M+ in equity is under 1%. That same capital deployed in a diversified index fund has historically returned 8–10% annually with full liquidity and no management overhead. The numbers strongly favor selling unless Miami appreciation significantly outpaces projections.
Rental ownership does carry meaningful write-offs: mortgage interest, property taxes, insurance, maintenance, management fees, and depreciation (building value spread over 27.5 years) are all deductible against rental income. Depreciation on a home of this size and value could offset $80,000–$100,000+ in paper losses annually — potentially reducing taxable rental income to near zero even with positive cash flow. Passive activity loss rules may apply depending on income level. Consult your CPA.
The financial math strongly favors selling now. The primary reason: selling while the home qualifies as a primary residence protects the full §121 capital gains exclusion, and $2.7M+ in equity redeployed at market rates significantly outperforms the thin cash flow this property generates as a rental. If a mortgage remains, the rental scenario likely produces negative cash flow — making the sell decision even clearer. The case for renting only strengthens if Miami appreciates at 6–7%+ annually and the tax write-offs are actively utilized. Rental income can be supplemented by depreciation deductions to create a net paper loss, but the opportunity cost of illiquid equity in a single property versus a diversified portfolio is substantial. All figures are estimates. Consult your CPA and financial advisor before making any decision.
† 5-year rental scenario assumes no mortgage, 4% annual appreciation, 6% selling cost at year 5, 50% nonqualified use fraction (5 rental years / 10 total years), partial §121 exclusion applied at 23.8% federal LTCG rate + 25% depreciation recapture. Actual tax liability depends on purchase basis, improvements, depreciation claimed, and individual tax situation. Source: IRS Publication 523, IRC §121(b)(4).
Whether you're selling for the first time or the fifth, having a clear picture of what's ahead reduces stress and keeps you in control. Here's exactly what to expect from strategy session through closing day.
We finalize price strategy, sign the listing agreement, and set the timeline. We align on pricing, marketing approach, showing preferences, and any pre-listing tasks to maximize first impressions.
Professional photography, drone footage, and 3D walkthrough are scheduled and completed. Staging consultation is provided. MLS listing is prepared and reviewed for accuracy before going live.
Your home goes live on the MLS and all major portals simultaneously. Social media campaign launches, email campaign delivers to the buyer database, and targeted agent outreach begins the same day.
Jose personally attends all showings or ensures every showing is handled by a trusted agent. You receive weekly feedback reports, showing counts, and market updates so you always know exactly where things stand.
When an offer comes in, we review every detail together — not just price, but terms, contingencies, financing strength, and closing timeline. I advise on counter-offer strategy and help you evaluate multiple offers side-by-side.
Florida contracts include a 10–15 day inspection period. We navigate repair requests and credits together. The buyer's lender simultaneously orders an appraisal. I manage every step to keep the transaction moving forward.
Title company conducts a full search, clears any encumbrances, and issues the commitment. You receive a full closing disclosure showing every credit, debit, and your estimated net proceeds — no surprises at the table.
Both parties sign at the title company. The buyer's funds wire in, the loan is funded, all parties are paid, and the deed transfers. Once funding is confirmed, you hand over the keys. Done.
Here's what happens next. From signed agreement to sold — every step is handled with precision, transparency, and your goals at the center.
We formalize our partnership, confirm the list price, and set the official timeline for launch.
Photography, drone, 3D tour, MLS entry, and full marketing campaign — activated within days of signing.
I handle every offer, every negotiation, every detail — from accepted offer to keys exchanged and funds wired.